
Practical exams are an important part of Physics HSC. In fact, it is mandatory for your school to conduct a practical in-class physics assessment and a depth study which combined will form 60% of your overall school internal assessment mark. So it is not enough to just learn the content and ace tests; you need to be able to apply your knowledge in the real world too.
What is in Practical Assessments?
The assessment is meant to assess these dot points in the syllabus where students learn how to
- Assess the validity, reliability and accuracy of any measurements and calculations.
- Determine the sources of systematic and random errors.
- Identify and apply appropriate mathematical formulae and concepts.
- Draw appropriate graphs to convey relationships.
Now, we cannot be sure exactly how your school will want to conduct this assessment, but it will be either one of two ways:
- As a first-hand investigation where students carry out an experiment and obtain data themselves (most common), or;
- A second-hand investigation where the experiment is described, data is given and students must analyse the process and results of the experiment.
Either way, students will be faced with the same five challenges:
- Validly collect data
- Interpret that data
- Perform relevant calculations
- Analyse the method and result
- Identify the error and its impact.
How to craft the Perfect Practical?
1) Data Collection
Independent Variable - A variable that is changed in an investigation to see what effect it has on the dependent variable.
Dependent Variable - A variable that changes in response to changes to the independent variable in an investigation.
Independent is always plotted along the x-axis and dependent is always plotted along the y-axis.
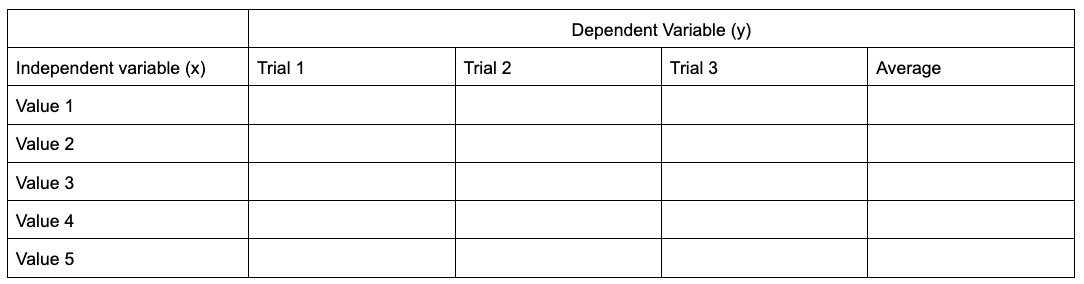
Walk in with a table template in mind so you don't have to waste time stressing about how to record your data. This one works for almost any type of experiment. You need to be taking at least three trials (if not more) for reliability and anywhere between 1-5 different independent values. Remember to include units in your labels!!
2) Data Analysis
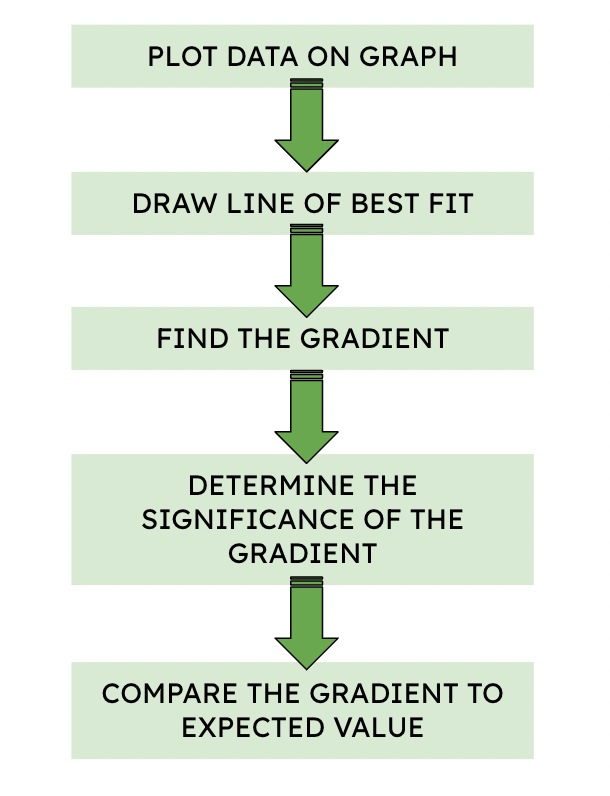
Data analysis starts by plotting your results on a graph (using average values to improve reliability). 99/100 times, you should be expecting a straight line because what we are really analysing here is the gradient (you will see why in a moment).
Think about what you are actually investigating. If I am exploring the relationship between mass and weight force, then I know my graph should be a straight line. Sometimes, data needs to be manipulated in order for the graph to produce a straight line.
This is where a good understanding of theory is important. For example, if I were to explore the relationship between velocity and centripetal force, graphing velocity vs force would give me an ugly parabola that's hard to interpret. But if I graphed velocity^2 vs force I would get a nice easily to analyse straight line. That's the goal!
When graphing be sure to use CUTLASS as a checklist to ensure your graphs are full marks:
C - crosses (always use crosses when marking points)
U - units (ensure units are labelled and logical. For example, don't use kilograms when measuring the weight of a marble)
T - Titles (tables, graphs and axes all need titles!!)
L - Line of best fit (your line of best fit should go in between. You basically want the same number of crosses above and below. Do not play connect the dots and do not just put it through as many points as possible. It also doesn't need to go through the origin.)
A - Axes (ensure you have the relevant axes. Independent as your x and dependent as your y)
S - Scale (ensure your measurements are logically scaled and go up in steps.)
S - Size (graphs should always take up at least 3/4 of the space provided. Tiny graphs will get you tiny marks.)
Once your graph is perfect, use rise/run to calculate the gradient. Now this is why we want to be graphing straight lines. Let's go back to my mass versus weight force experiment. Not only am I expecting a linear graph, but I am expecting it to have a positive gradient of 9.8. If my experimental gradient is wayyyy off, I can be sure that my experiment was not accurate. When conducting experiments we are always wanting to validate pre-existing theories and by comparing our gradients to a known and expected value we can validate the accuracy
3) Analysis of method and result
Undoubtedly the most important section is the analysis component. This is where knowing definitions is super important.
Accuracy - An extent to which measured results are to the correct or accepted value.
- Test: By comparing measured values to expected values from theory and calculations. Also by whether or not the line of best fit passes through the origin.
- Improved: By minimising systematic errors and calibrating equipment.
Reliability - An extent to which repeated observations and/or measurements taken under identical circumstances will yield similar results.
- Test: Repeating experiments and observing the level of consistency. By examining if results follow a clear (linear) trend.
- Improved: By minimising random errors in the method and averaging results.
Validity - An extent to which tests measure what was intended; an extent to which data, inferences and actions produced from tests and other processes are accurate.
- Test: Are control variables constant and does the experimental method test the hypothesis? Note; an experiment can be reliable but not accurate or accurate but not reliable. However, it must be accurate and reliable in order to be valid.
- Improved: By ensuring that the experimental method satisfies assumptions, holds control variables constant and the method works to address the aim.
4) Identifying errors and suggesting improvements.
Analysing however is only the initial step. You must also be able to explain the root of your experiment's inaccuracy or unreliability and suggest relevant and detailed improvements.
Let's start by discussing the two types of errors.
Systematic errors are those that shift measurements from true value by the same proportion every time. They impact accuracy and so to improve accuracy you need to eliminate systematic errors.
Improvements include calibrating equipment, addressing assumptions (like if we were to ignore air resistance) or ensuring the temperature of the lab is the same as the one conducted in theory.
Random errors are those that shift measurements from true values by random amounts each time. They impact reliability, and so to improve reliability you need to eliminate random errors.
The most common random error comes from ' reaction time' (don't use the phrase human error) which can be improved by lengthening the period of time. For example, instead of measuring the time it takes for the ball to swing in a circle, it would be more reliable to measure the ball swing around ten times and divide my measurement by ten. Other improvements to reliability involve conducting the experiment in an enclosed lab using the same conditions every time.
Conclusion
Want more personalised study guidance to help drastically improve your marks? A private tutor from KIS Academics can make the biggest difference! For more study tips to ace your HSCs, check out these articles:
 Manoj Arachige
 Manoj Arachige
 Manoj Arachige
FAQs
How do I Prepare for the Practical Exam?
- Revise EVERY experiment you've studied. Jot down steps, expected observations, and key formulae.
- Practice writing clear, logical methods and results.
- Know how to draw and label clear graphs, including axes and units.
What is the Difference between Validity, Reliability and Accuracy?
- Validity: Your experiment actually tests the aim (controls, clear independent/dependent variables).
- Reliability: Consistency of results; achieved by repeating measurements and looking for similar data.
- Accuracy: Closeness to the ‘true’ value; improved by proper calibration and minimising systematic errors.
How should I Analyse Errors and Uncertainties?
- Identify sources of random and systematic error in your practical.
- Discuss the impact of each error on your results, and suggest improvements.
- Include sample calculations for measurement uncertainty.
Written by KIS Academics Tutor for HSC Physics, Thao Peli Nghiem Xuan. Thao received an ATAR of 99.55 and is pursuing a Bachelor of Mechanical Engineering at the University Of New South Wales. You can view Thao's profile here and request her as a tutor.


