
If you are struggling to write your QCAA IA2 Chemistry Student Experiment Report, you have come to the right place. Let me break down what is required of you, and give you my best tips to ace this assessment.
Table Of Contents:
How To Structure A Chemistry IA2Report?
1. Research Questions (max 50 words)
Make sure your RQ is both relevant & specific. Clearly articulate your independent and dependent variables, like:
- How does changing X affect Y?
- The effect of changing X on Y.
Be specific when stating your variable. For instance, instead of just saying “concentration”, write “concentration of X solution at X location”.
2. Rationale (300-400 words)
Your rationale should explain the logical sequence of how you reached your RQ. Make sure that your rationale hits the following points:
- Must be relevant to YOUR research question.
- Describe the concepts underlying your experiment (e.g. what are redox reactions; how do galvanic cells work).
- Include the relevant chemical equations.
- Introduce your variables – what is the relationship between them?
- Provide the mathematical formula that describes this relationship.
3. Modified Method (100-150 words)
What modifications did you make so that the experiment could address your RQ?
- Define the type of modification – Were the changes made a redirection, extension or refinement of the OG method?
- Explain the modification – What did you change? Include precise details such as changes to the number of trials conducted or concentrations tested.
- Justification – Why did you make these changes? Was it to increase validity, reliability or precision? If so, how do these changes do that?
For this section, I recommend using the following table headings:

4. Risk Assessment (100-120 words)
For this section, briefly summarise the risks of conducting the experiment and what you did to manage these using the following table format:
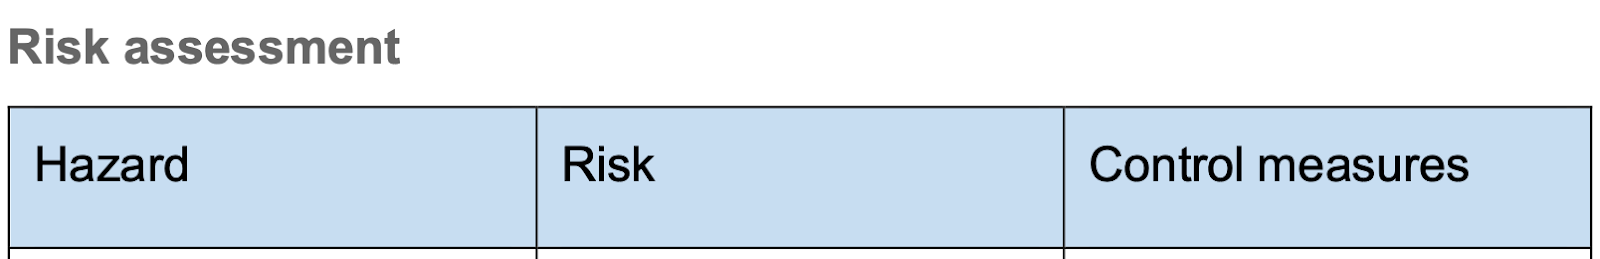
Make sure to mention ethical and environmental risks in a brief paragraph. For example, the use of waste buckets for chemicals could be a control measure for environmental risk. If there are no ethical concerns, briefly mention this too.
5. Results (100-120 words)
The results section comprises of a few key parts:
1) Raw data
- A table containing your raw results – with no calculations!
- Should have a minimum of 5 variations (e.g. 5 different concentrations).
- Should have a minimum 3 trials per variation.
- Include units, table headings & uncertainties.
- Ensure your significant figures are consistent.
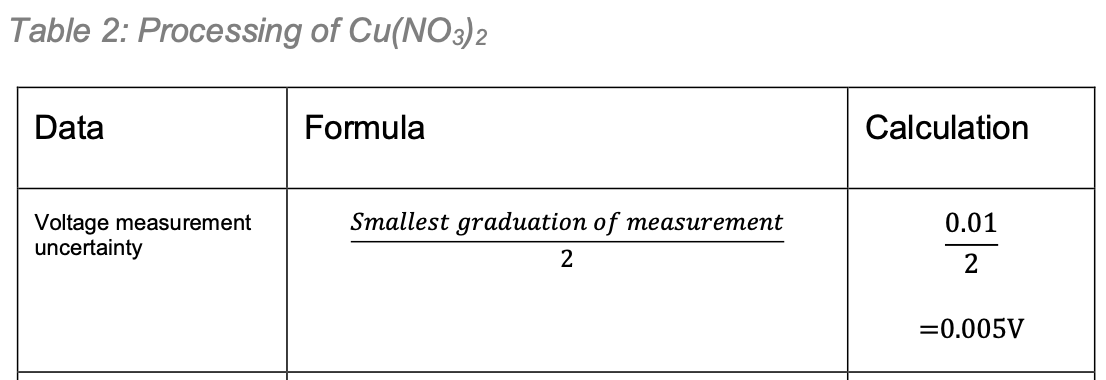
2) Processed data – sample calculations
- A table containing your calculations for processing your raw data.
- Give one example per data (e.g. 1 for uncertainty, 1 for concentration, etc.).
- See below for an example of how you should layout your table:
3) Processed data – tabulated
- Table summarising your processed data.
- This may include your mean, uncertainty of the mean, difference and % difference calculations.
4) Main graph
- This graph shows the relationship between the dependent (y-axis) and independent (x-axis) variables.
- Make sure to label axis correctly + include units.
- Provide a line of best fit, including the equation + R-squared value of the line.
Not sure if you are writing with clear and correct grammar? Fret not, use KIS Academic's free assignment marking tool! 👇
6. Trend, Patterns & Relationships (150-200 words)
This is the part where you need to interpret the graph:
- Are there clear trends in the data?
- What is the equation of the trendline?
- Does it fit the data well (i.e. R-squared)?
- What is the relationship between the variables?
- Provide the mathematical term (e.g. is it linear?).
- Is there a proportional relationship?
Explicitly state the R-squared values, the equation of the trendline and the data points that fit or do not fit this trend in your interpretation. Be as specific as possible.
7. Uncertainty and Limitations (150-200 words)
- What were the uncertainty calculations?
- Are there differences between the theoretical and actual values?
- Why do you think these differences occurred?
- Were there limitations to the method that may have caused this?
8. Evaluation (300-400 words)
1) Reliability
- Was the uncertainty high or low?
- What does this suggest about the reliability of your results?
2) Validity
- How different was the expected/theoretical value from your experimental value?
- What does this suggest about the validity of your results?
- Maybe some things did go as expected – what were they?
- Were the modifications truly successful in allowing accurate measurements?
9. Improvements (50-100 words)
- Provide improvements that directly address the limitations of the experiment you just identified in the evaluation and analysis.
- Did you see systematic or random errors? If so, what were they?
- How could you improve your method to prevent these from occurring next time?
10. Extensions (50-100 words)
- Provide a relevant extension that relates to your experiment.
- Is there a different relationship you should investigate next?
- e.g. changing the independent variable from concentration to temperature
- Can you extend your experiment to provide greater detail?
- e.g. expanding the range of concentrations
11. Conclusion (100-150 words)
- Restate the aim of your experiment.
- Briefly summarise your RQ – what variables were you testing?
- Briefly state what your results showed – what was the relationship between your variables? What were the key findings?
- Support this conclusion with some evidence (e.g. best-fit equation + R-squared).
- Restate your hypothesis – what did you expect? Was the hypothesis supported?
- Briefly summarise some limitations.
What Does A Full Mark IA2 Response Look Like?
A high-mark student experiment should cover of the following key criteria of the ISMG:
- Research and planning
- Analysis of evidence
- Interpretation and evaluation
- Communication
You should cover all components of each criterion to get the top marks.
For an in-depth example of what a high-level IA2 looks like, check out the annotated sample responses on the QCAA website. I would recommend also looking at the mid-level sample response to see where they went wrong, and ensure that you don’t make the same mistakes.
Get personalised support from our QCE Chemistry Tutor Specialists who understand what it exactly takes to get full marks! 👇
Tips & Tricks
1. Start Early
It can be tempting to procrastinate, but starting early really gives you that advantage. It means more time to brainstorm, troubleshoot, and edit.
It also helps prevent you from feeling overwhelmed and rushing parts of your assignment.
2. Highlight the ISMG
Know what you are being marked on! Spend 10 minutes looking through the ISMG to be more familiar with what you need to cover. It’s easy to miss a key point in the criteria so make sure you know what not to miss!
3. Mark your Own Work
Now that you’ve highlighted the key parts of the criteria, try seeing where your IA2 sits! Self-marking using the criteria sheet is such a good way to see where you could improve, or conversely where you have already nailed it.
Alternatively, you can also get somebody else to review your work. It could be your parent, sibling, friends, or even your tutor. It is always good to have a second pair of eyes!
4. Format your Report Appropriately
Remember to follow the QCAA template for formatting. This includes using subheadings, figure headings, accurately labelling graphs and data, having a neat appendix, and making sure your work is readable.
Make it easy for markers to follow the flow of your experimental write-up! This also makes it easy for you to review your work while writing it.
Conclusion
You are now ready to ace your IA2. Utilise this guide well, and always seek help when you find yourself stuck at a part of your report. All the best!
After more resources? Check these out! 👇
 Manoj Arachige
 Manoj Arachige
 KIS Academics
FAQs
How much is the IA2 worth?
- The IA2 makes up 20% of your final grades, so it is imperative to do well.
How do I Choose an Experiment?
- Select a practical related to chemical equilibrium or redox, then modify it by changing a variable, method, or scope.
Can I work in a Group?
- QCAA state that you may collaborate when selecting the experiment, developing the research question, conducting the risk assessment, and collecting data.
- However, all analysis, interpretation, evaluation, and the written report must be completed individually.
Written by Cyrah Finlayson who studied Biomedical Science at Monash University and Psychology at UNSW.


