
As a parent, receiving your child's NAPLAN results can be exciting but also a bit daunting if you're unsure how to interpret them. NAPLAN, the National Assessment Program – Literacy and Numeracy, assesses skills that are essential for every child to progress through school and life. This blog will walk you through how to interpret these results, breaking down the sections, the graphs, and what the results really mean for your child’s learning journey.
Once you understand the results, the next step is knowing how to act on them. Our guide on how to prepare your child for NAPLAN covers targeted preparation strategies for each year level.
Table of Content:
- How to Understand the NAPLAN Report?
- What Does the NAPLAN Report Look Like?
- What Do the Results Mean for Your Child?
- FAQs
How to Understand the NAPLAN Report?
The NAPLAN report provides an overview of your child’s performance in four key areas: Reading, Writing, Language Conventions (spelling, grammar, and punctuation), and Numeracy. Each area is scored, and these scores are presented in a graphical format.
If you need more of an explanation about what NAPLAN is and what the exam is like, be sure to check out our other articles:
What Does the NAPLAN Report Look Like?
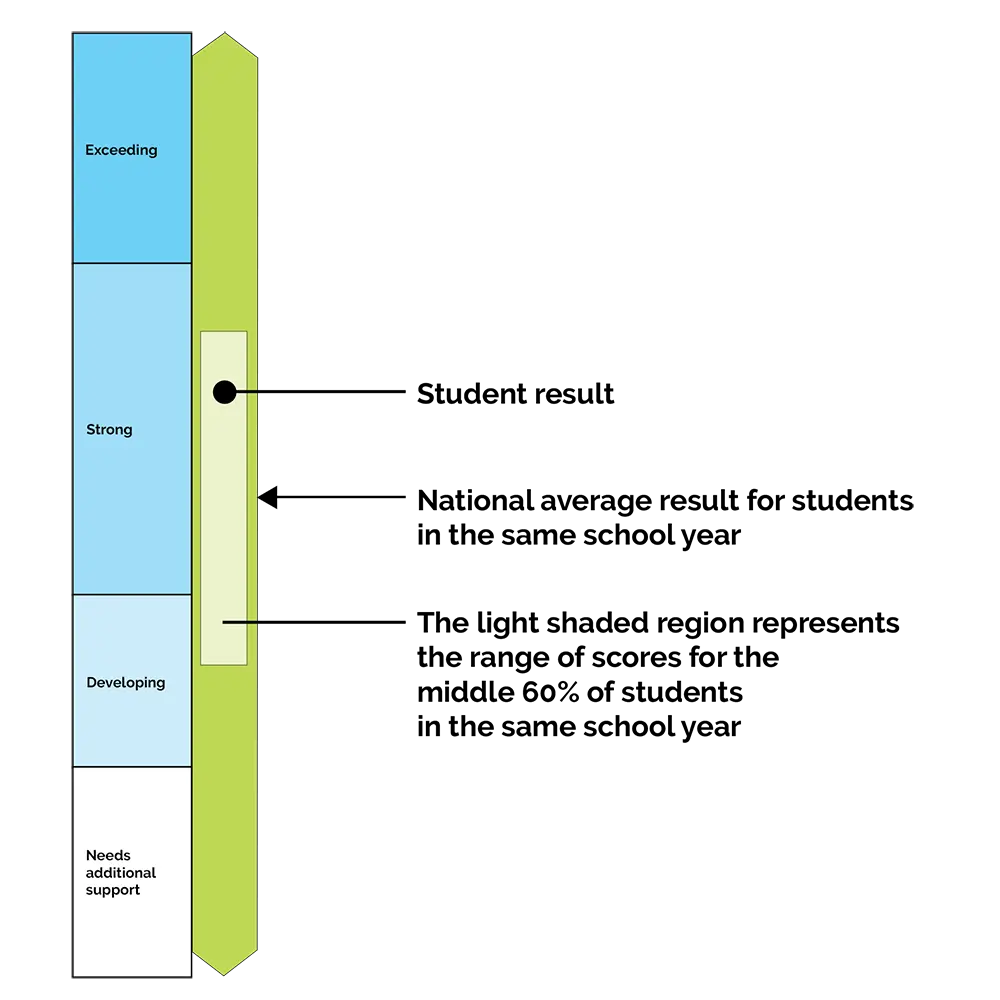
Each subject area is represented with a bar graph that shows your child's performance (refer to image below). Your child's score is shown with a black dot (or marker) on the scale, and this scale also compares your child's result with the national average and the performance of students within the same year group.
Alongside this graph above, there will also be a descriptive text explaining your child’s achievements in relation to the proficiency bands.
💬 What Are the Sections of the Report?
- Proficiency Bands: Students' skills are classified into 4 proficiency level - Exceeding, Strong, Developing and Needs additional support.
- Comparison Points: Each report contains markers showing how your child performed compared to the national average, and 60% of students in the same school year.
How to Interpret the Graphs?
The bar graph displays several key points:
- The dot or marker: This shows your child’s specific score.
- The shaded box: This represents the range of scores achieved by the middle 60% of students in the same year.
- The national average: The arrow indicates how the average student in Australia performed.
When interpreting the graphs, take note of where your child’s marker lies in relation to the national average and the range of scores. If your child’s marker is towards the top of the green box, this suggests a stronger performance in that subject.
What Do the Results Mean for Your Child?
Your child’s NAPLAN results are a reflection of their current skills in literacy and numeracy. However, they are not the be-all-end-all of their academic future. NAPLAN is just one assessment that provides a snapshot of where your child is at in their current learning.
Use the results to identify areas where your child excels, and areas where they might need extra support. Speak to their teacher about how to use the results to better support your child in their learning experience.
Conclusion
Understanding your child’s NAPLAN results can give you valuable insights into their educational development. Use this information to guide your child’s learning and to celebrate their achievements, while also identifying areas for growth.
For more resources on NAPLAN and how to support your child’s learning journey, visit the official NAPLAN website, or check out these KIS Academics articles:
 Manoj Arachige
 Manoj Arachige
 Manoj Arachige
FAQs
What does it mean if my child got a mark in the top of the ‘average’ band?
If your child’s marker is in the top part of the ‘average’ band, it means they are performing at the higher end of what is expected for their year level. It indicates that your child is meeting the standard and may even be approaching a higher proficiency.
What’s the difference between the four sections of the results?
The four sections—Reading, Writing, Language Conventions, and Numeracy—each assess different aspects of your child’s literacy and numeracy skills. Reading tests comprehension and understanding, Writing evaluates the ability to communicate ideas clearly, Language Conventions assess spelling, grammar, and punctuation, and Numeracy measures math skills like calculation and problem-solving.
What does it mean if my child’s marker is at the top of the graph?
If your child’s marker is at the top of the graph, this indicates that they are performing well above the national average in that subject area. It’s a sign that your child has a strong understanding and proficiency in the skills assessed.
Written by KIS Academics Tutor for HSC Mathematics, Chemistry, and Economics, Jonathan Gnanseelan. Jonathan is currently pursuing a Bachelor of Commerce/Actuarial Studies double degree at the University of New South Wales and has received countless stellar reviews from his current and past KIS Academics students. You can view Jonathan’s profile here and request him as a tutor.
What Our Students & Parents Say
600+ Five-Star reviews across all our tutoring programs — hear why below !👇
Related Reading
How to Prepare Your Child for NAPLAN
A practical guide for Australian parents — what NAPLAN actually tests, when to start, and how to build real skills without the pressure.


